| |
DAx is a general purpose peak analysis program,
yet includes specialised support for
- Capillary Electrophoresis
- Gel Permeation Chromatography
- Calibrations (e.g. DNA Base Pair Count determination)
- HPLC (with Gradient Correction)
- Gas Chromatography
- RFLP analyses (with automatic size calibration)
- SNP analyses
Simple
- DAx is highly customisable: unused options can be hidden from the user
- Measurements are typed (HPLC, GC, CE, GPC, Generic). Options that are not relevant to a certain data type will not be shown
DAx Data Acquisition
- Hardware options include PCI boards and USB solutions
- Multi channel data acquisition
- Hierarchical measurement linking
- Measurement sequences using sample changers
- Automatic re-calibrations during measurement sequences
- Various measurement triggering methods

Data Analysis Algorithms
- Baseline construction and subtraction
- Peak finding … and refusal
- Automatic peak shoulder detection
- Tangent skimming
- Spike removal
- RMS and “Trumpet” noise calculation

Automatic Parameters
Analysis parameters are derived from data

|

|
Baseline construction filter width derived from highest number
of consecutive data points with high derivative values
|
|
 |
Construct and subtract baseline
|
|
 |

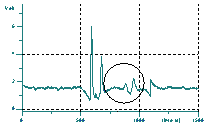
Sort by absolute value
|

The red lines are extrapolated to give the "Trumpet Noise Level".
This is then used to set up a threshold to find peaks.
|
|
Shoulder Peak Detection
Automatic shoulder peak detection based on up to 4 criteria

Degree of slant
|

Skim ratio
|
Shoulder detected when ratio

exceeds boundary value
|

Relative width
|

Relative area
|
Manual Editing
- Sizing data (for instance to compare / overlay them)
- Baseline corrections
- Adding, changing, removing peaks
- Marking shoulder peaks (shown)
All edit operations have 20 levels of undo.

|
The many equal peaks in the plot at left are turned into shoulder
peaks using a single click and drag operation.
|

|
Peak Qualification
Peaks are identified using an Identification Database
- Various qualifying parameters:
- peak top time, first peak moment
- peak begin or end time [ion chromatography]
- peak top elution volume
- molecular weight
- apparent mobility, effective mobility
- base pair count (calibrated value)
- coordinate relative to other peak(s)
- Various qualifying methods:
- near coordinate
- in interval (with or without area limit)
|
|

|
Peak Quantification
- Various quantifying parameters:
- peak top height
- peak area
- normalised peak area
- migration time corrected peak area
- migration time corrected normalised peak area
- Various calibration curve types:
- multi-linear
- spline
- polynomial
|

|
|
- Configurable per component or for entire database
|
|

|
Peak Comparison Sheets
Comparing duplicate measurements
- Various qualifying parameters to determine which peaks correspond
- peak top time, first peak moment
- peak top elution volume
- molecular weight
- apparent mobility, effective mobility
- base pair count
- Sheets can be one dimensional (list) or two dimensional (binning sheet)

Data Arithmetic
- Add, subtract, multiply, divide data by constants
- Add, subtract, multiply, divide data by other data
- Fourier (optimal) filtering (see below)
- Moving average filtering
- Savitzky-Golay filtering
- Convolution and Deconvolution
Fourier Filtering

Low pass filter results
|
|
High pass filter results
|


Detail view
|

Original signal
|
Optimum Fourier Filtering

Original signal
|
|

Optimum filtered
|
|
|
|
|
Derive characteristics: signal to noise ratio as function of filter width
|
|
 |
|
Use optimum filter width
|
|
Reports
- Reports can contain the following items:
- Logos (bitmaps or metafiles)
- Texts
- Variables (e.g. "filename)
- Data plots
- Peak lists
- Various calibration curves
- Lines &Rectangles
- Report editor is fully featured drawing program
- Multi page reports
- Several measurements on a single report page
- Automatic report printing when measurement ends
|
|

|
Analysis Assays
Automatically determine quality of analysis
- Baseline quality (interval, drift, noise)
- Peaks quality (maximum skew, number and area of unrecognised peaks)
- Presence of required peaks
- Presence of unwanted peaks
- Calibration quality (steepness, curvature)
|
|

|
DNA Fragment Analysis
- Read ABI, Amersham, SCF files
- Automatic size calibration details
- Create binning sheets to compare hundreds of samples
- Command line batch analysis enables processing of thousands of samples per day
- Locate specified base sequences in multiple samples simultaneously

|
|

|
SNP Base Call Sheets
- Specify base sequence with SNP locations
- Read up to hundreds of trace files
- Base Calls Sheet displays SNP locations in overview:

- Colour-view for alignment overview:

|
|
|
HPLC / GC Gradient Correction
- User entered or data derived gradients
- Convenient manual editing of gradients
- Gradient Percentages or Temperature Programme displayed as curve
- Subtracting Gradients
|

The signal value Gradient Nodes can be dragged using the mouse.
(Gradient shown exaggerated here for clarity.)
|
Subtract signal gradient
|

The second vertical axis is for the gradient level plot.
|
|
Capillary Electrophoresis
- Apparent and Effective mobility calculations
- Mobility axis
- Mobility tracking
- Recognising components by mobility
- Recognising components by peak begin / end coordinate
- Normalised (corrected) peak areas
- Can be used to quantify components
- Reference peaks mark EOF
- Reads ABI Genescan and Amersham MegaBACE files
Calibrations: DNA Base Pair Count Determination
- Calibration Curves (see below)
- Saving and Loading Calibrations
- Calibrated value axes:

Base Pair Count
|
|
|
Calibration Curves in DAx
Calibration curves are used:
- for quantitative analysis
- to derive molecular weights in GPC

- to derive calibrated values, such as DNA base pair counts

All calibrations can take several forms:
- poly-line (connecting data points with straight lines)
- cubic spline
- polynomial
- linear and logarithmic calibrations (not for quantitative analysis)
|
 Example of a calibration curve. The calibration is a first order polynomial.
The two points at the extreme left have been excluded from the calibration (they
are marked with circles rather than dots).
|
Gel Permeation Chromatography
- Calibration curves relating molecular weight to elution volume
- multi-linear
- cubic spline
- polynomial
- linear or logarithmic
- Recognising components by Mp, Mn, Mw or Mz
- Tracking molecular weight
- Molecular weight axes
- Elution volume axes
|
|
|
Data Presentation
|
|
- Data set overlaying (with or without normalising)
- Extensive peak labeling and annotation
- Fully customisable reports (including logos)
- Copying graphs to clipboard using metafiles
- Exporting data
- Several ASCII based files
- Andi (AIA) files
|
|

|
Data Lists
Quick Reference Overview of Data Files
- Data Lists list numerous properties:
| |
- File name
- File date & time
- File type
- Data set name
|
- Operator name
- Measurement time
- Number of data points
- Frequency
|
- Ordinate name
- Description
- Data type
|
- Sort by any property
- Search for property values
- Select all files that meet one or more search criteria
- Display component concentrations overview for all data files in list
Command Line Use
Direct analyses entirely from the command line
for very high through-put applications
For details click here

Good Laboratory Practice
- Name registration (with password login)
- Error messages and warnings are logged
- Operations on data are logged
- Preservation of raw measurement data
- File overwrite prevention
|
|
|
|